
Context
What is ACME
Context
What is ACME
ACME is an academic interaction design project focused on enhancing the efficiency and engagement of a credit card fraud detection call center. The project involved designing a gamified dashboard system for two key user groups — managers and investigators.
The goal was to solve operational inefficiencies and foster motivation by redesigning how performance data, case management, and model accuracy were tracked and visualized. For managers, the dashboard offered a high-level view of team performance, workload distribution, and fraud detection accuracy. For investigators, it provided intuitive tools for case resolution and opportunities for recognition through gamification.
By embedding game mechanics such as challenges, points, and leaderboards into the workflow, ACME aimed to increase productivity, improve decision-making, and reduce operational monotony — all while aligning individual incentives with organizational goals.
Problem
Inefficient operations and lack of agent motivation were stalling fraud resolution
Problem
Inefficient operations and lack of agent motivation were stalling fraud resolution
The existing fraud detection dashboard at the call center was functional but fragmented, uninspiring, and operationally limiting. Managers struggled with low visibility into performance metrics, ineffective resource management tools, and no direct way to monitor the accuracy of fraud detection models. Investigators lacked the motivation and feedback loops necessary for continuous improvement.
The existing fraud detection dashboard at the call center was functional but fragmented, uninspiring, and operationally limiting. Managers struggled with low visibility into performance metrics, ineffective resource management tools, and no direct way to monitor the accuracy of fraud detection models. Investigators lacked the motivation and feedback loops necessary for continuous improvement.
Operational Challenges
Inefficient Case Management: Managers faced delays and imbalances due to clunky tools for case reassignment.
Limited Model Visibility: Lack of insight into AI model performance hindered effective oversight.
Disconnected Metrics: Team and agent performance data were spread across systems, reducing real-time decision-making.
Engagement & Motivation Gaps
No Incentive Systems: Agents had no clear motivation to exceed targets or collaborate.
Challenge Creation Was Manual or Absent: Managers had no structured way to set goals or track performance-based tasks.
Lack of ROI Tracking: The impact of performance efforts on actual business outcomes was invisible.
Objectives
Empower managers, engage agents
Objectives
Empower managers, engage agents
Operational Optimization
Enhance Team Visibility: Provide managers with real-time insights into agent productivity, queue status, and workload distribution.
Improve Case Reassignment: Design tools for seamless redistribution of fraud cases to balance workload and improve turnaround time.
Enable Model Monitoring: Introduce features that allow managers to track the accuracy and drift of fraud detection models.
Gamification Integration
Motivate Through Challenges: Enable managers to create performance-based challenges that promote healthy competition and collaboration.
Design a Reward System: Introduce point-based rewards (e.g., PTO, gift cards, charitable donations) tied to agent KPIs.
Measure Engagement ROI: Visualize the impact of gamification on team performance across metrics like productivity, accuracy, and retention.
Design Process
Design Process
Bet Evaluation
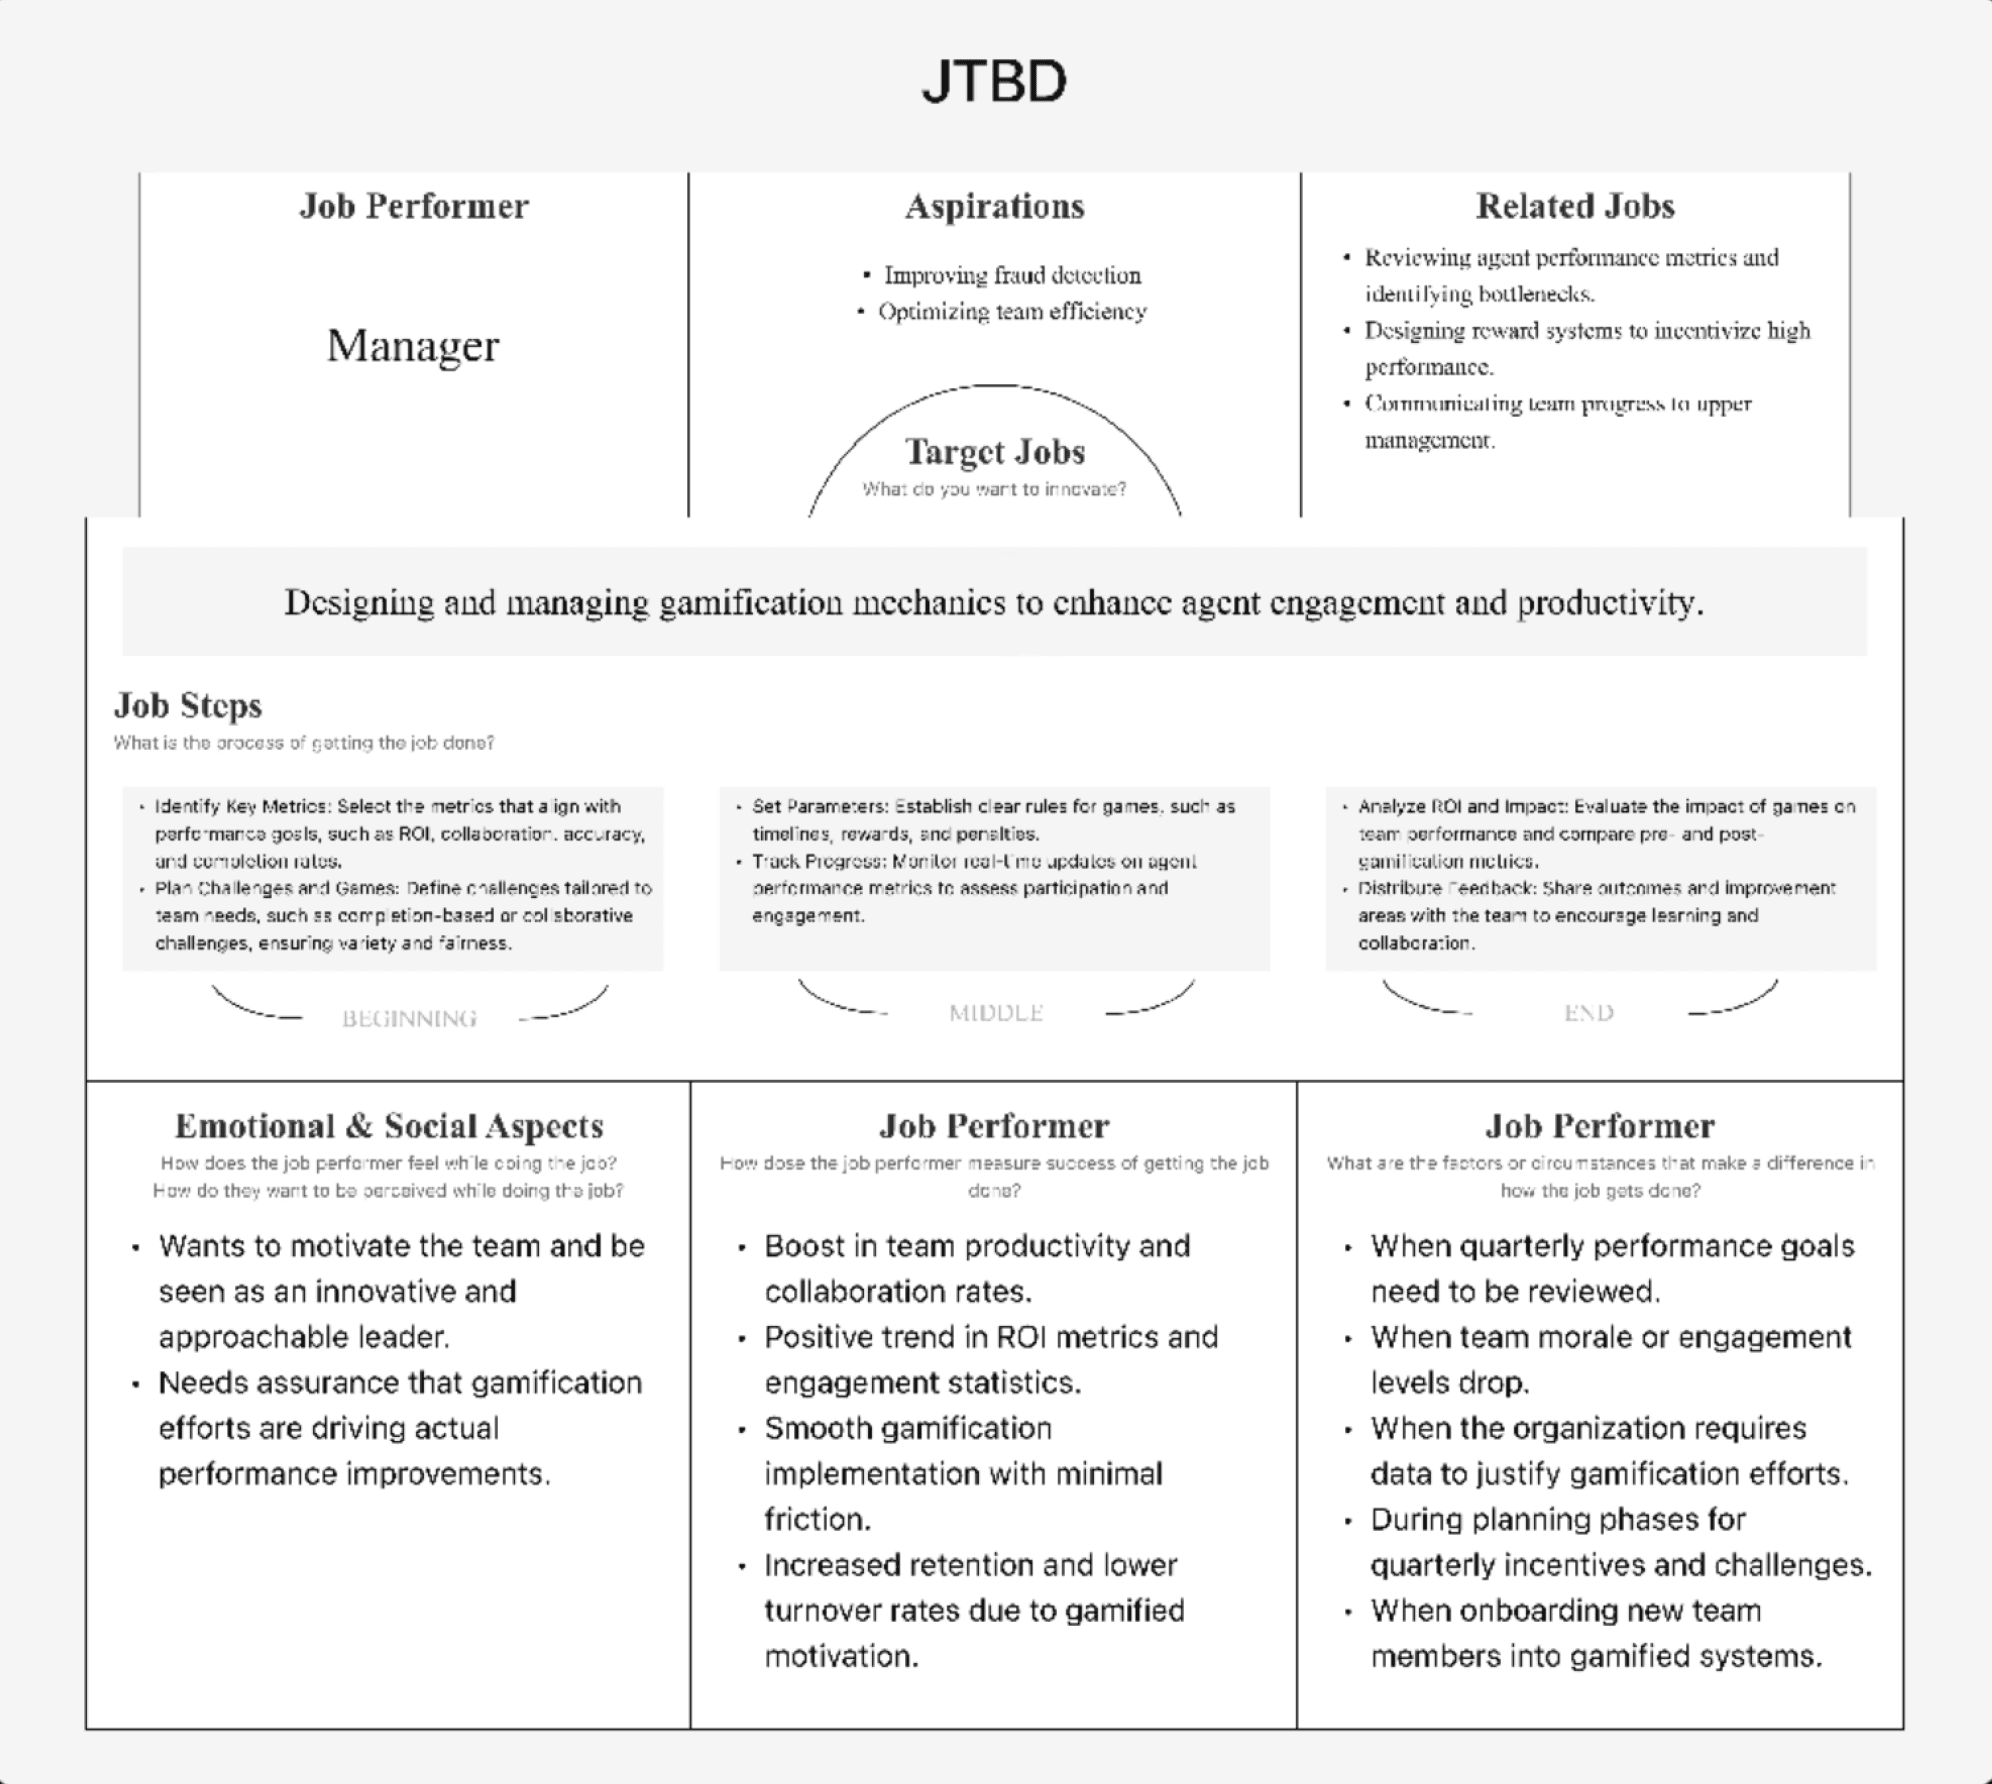
UNDERSTANDING THE CONTEXT: JOBS-TO-BE-DONE (JTBD) FRAMEWORK
1. Initiated the process with a JTBD framework to understand the
managers' goals, aspirations, and challenges.
2. Mapped out their critical workflows, such as monitoring agent performance, managing queues, and tracking ROI.
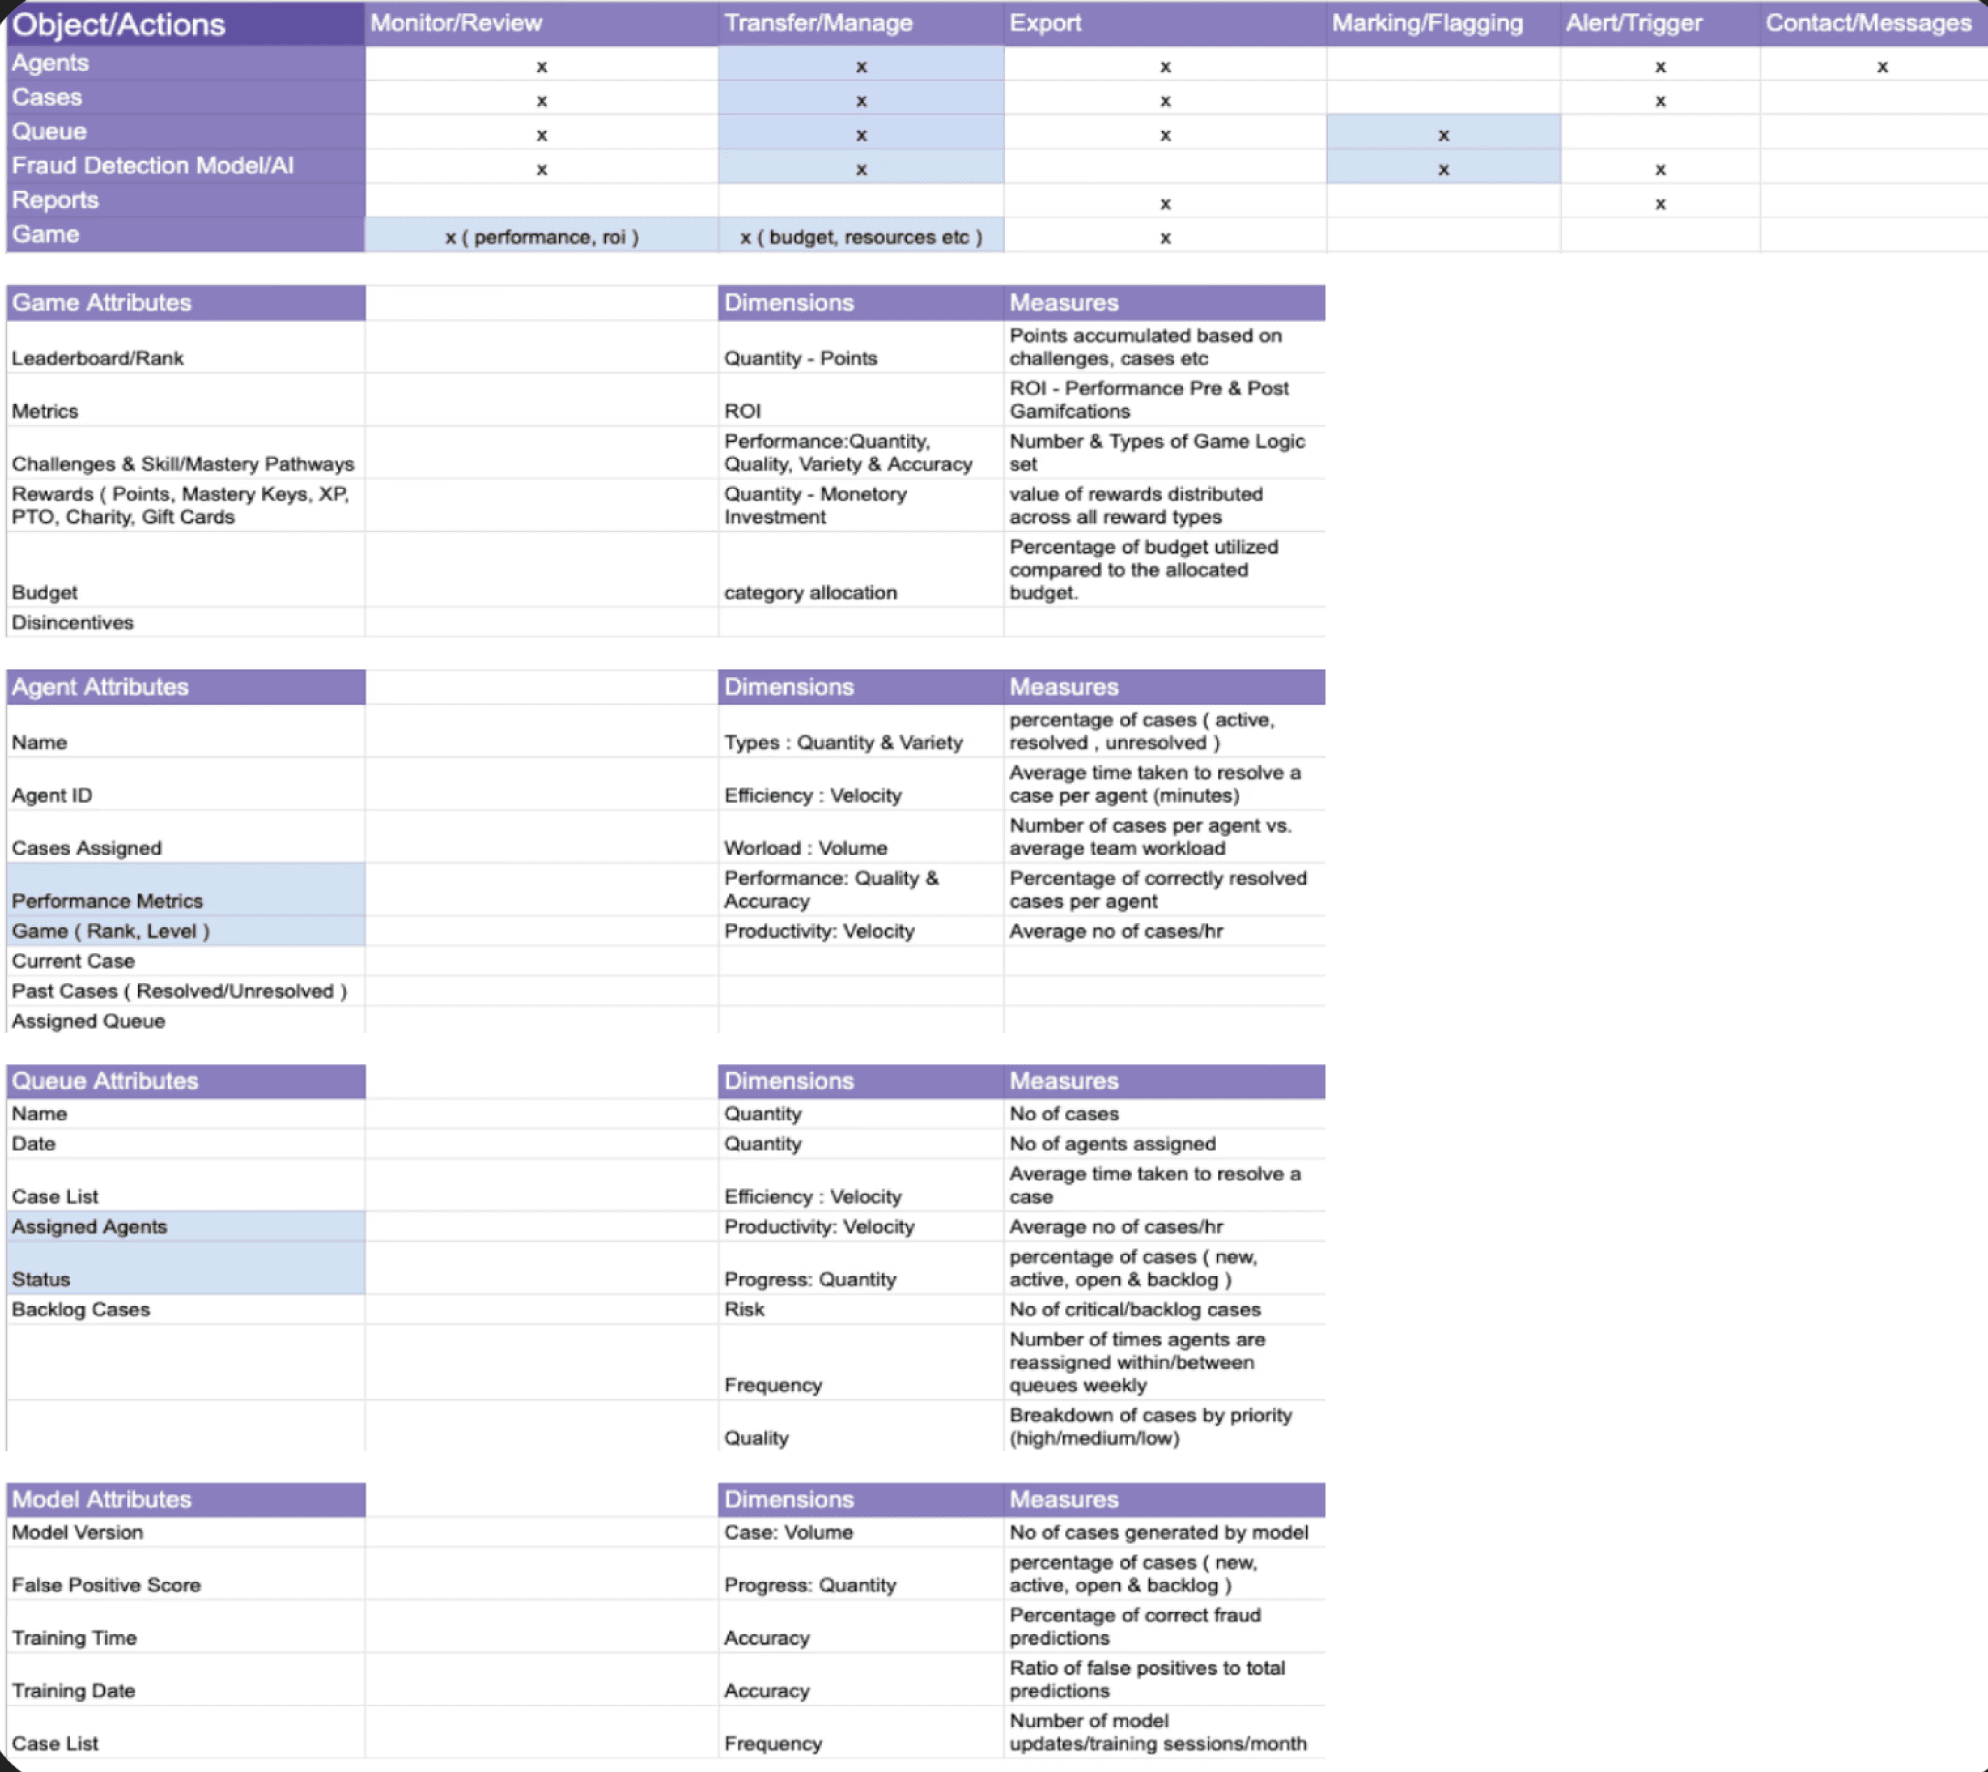
OBJECT-ACTION-ATTRIBUTE (OAA) MATRIX
1. Expanded on JTBD insights by creating an OAA matrix to outline the essential objects (agents, cases, queues), their actions, and associated attributes.
2. Enhanced the matrix with Dimensions and Measures, such as velocity, volume, and accuracy, for effective tracking and analysis.
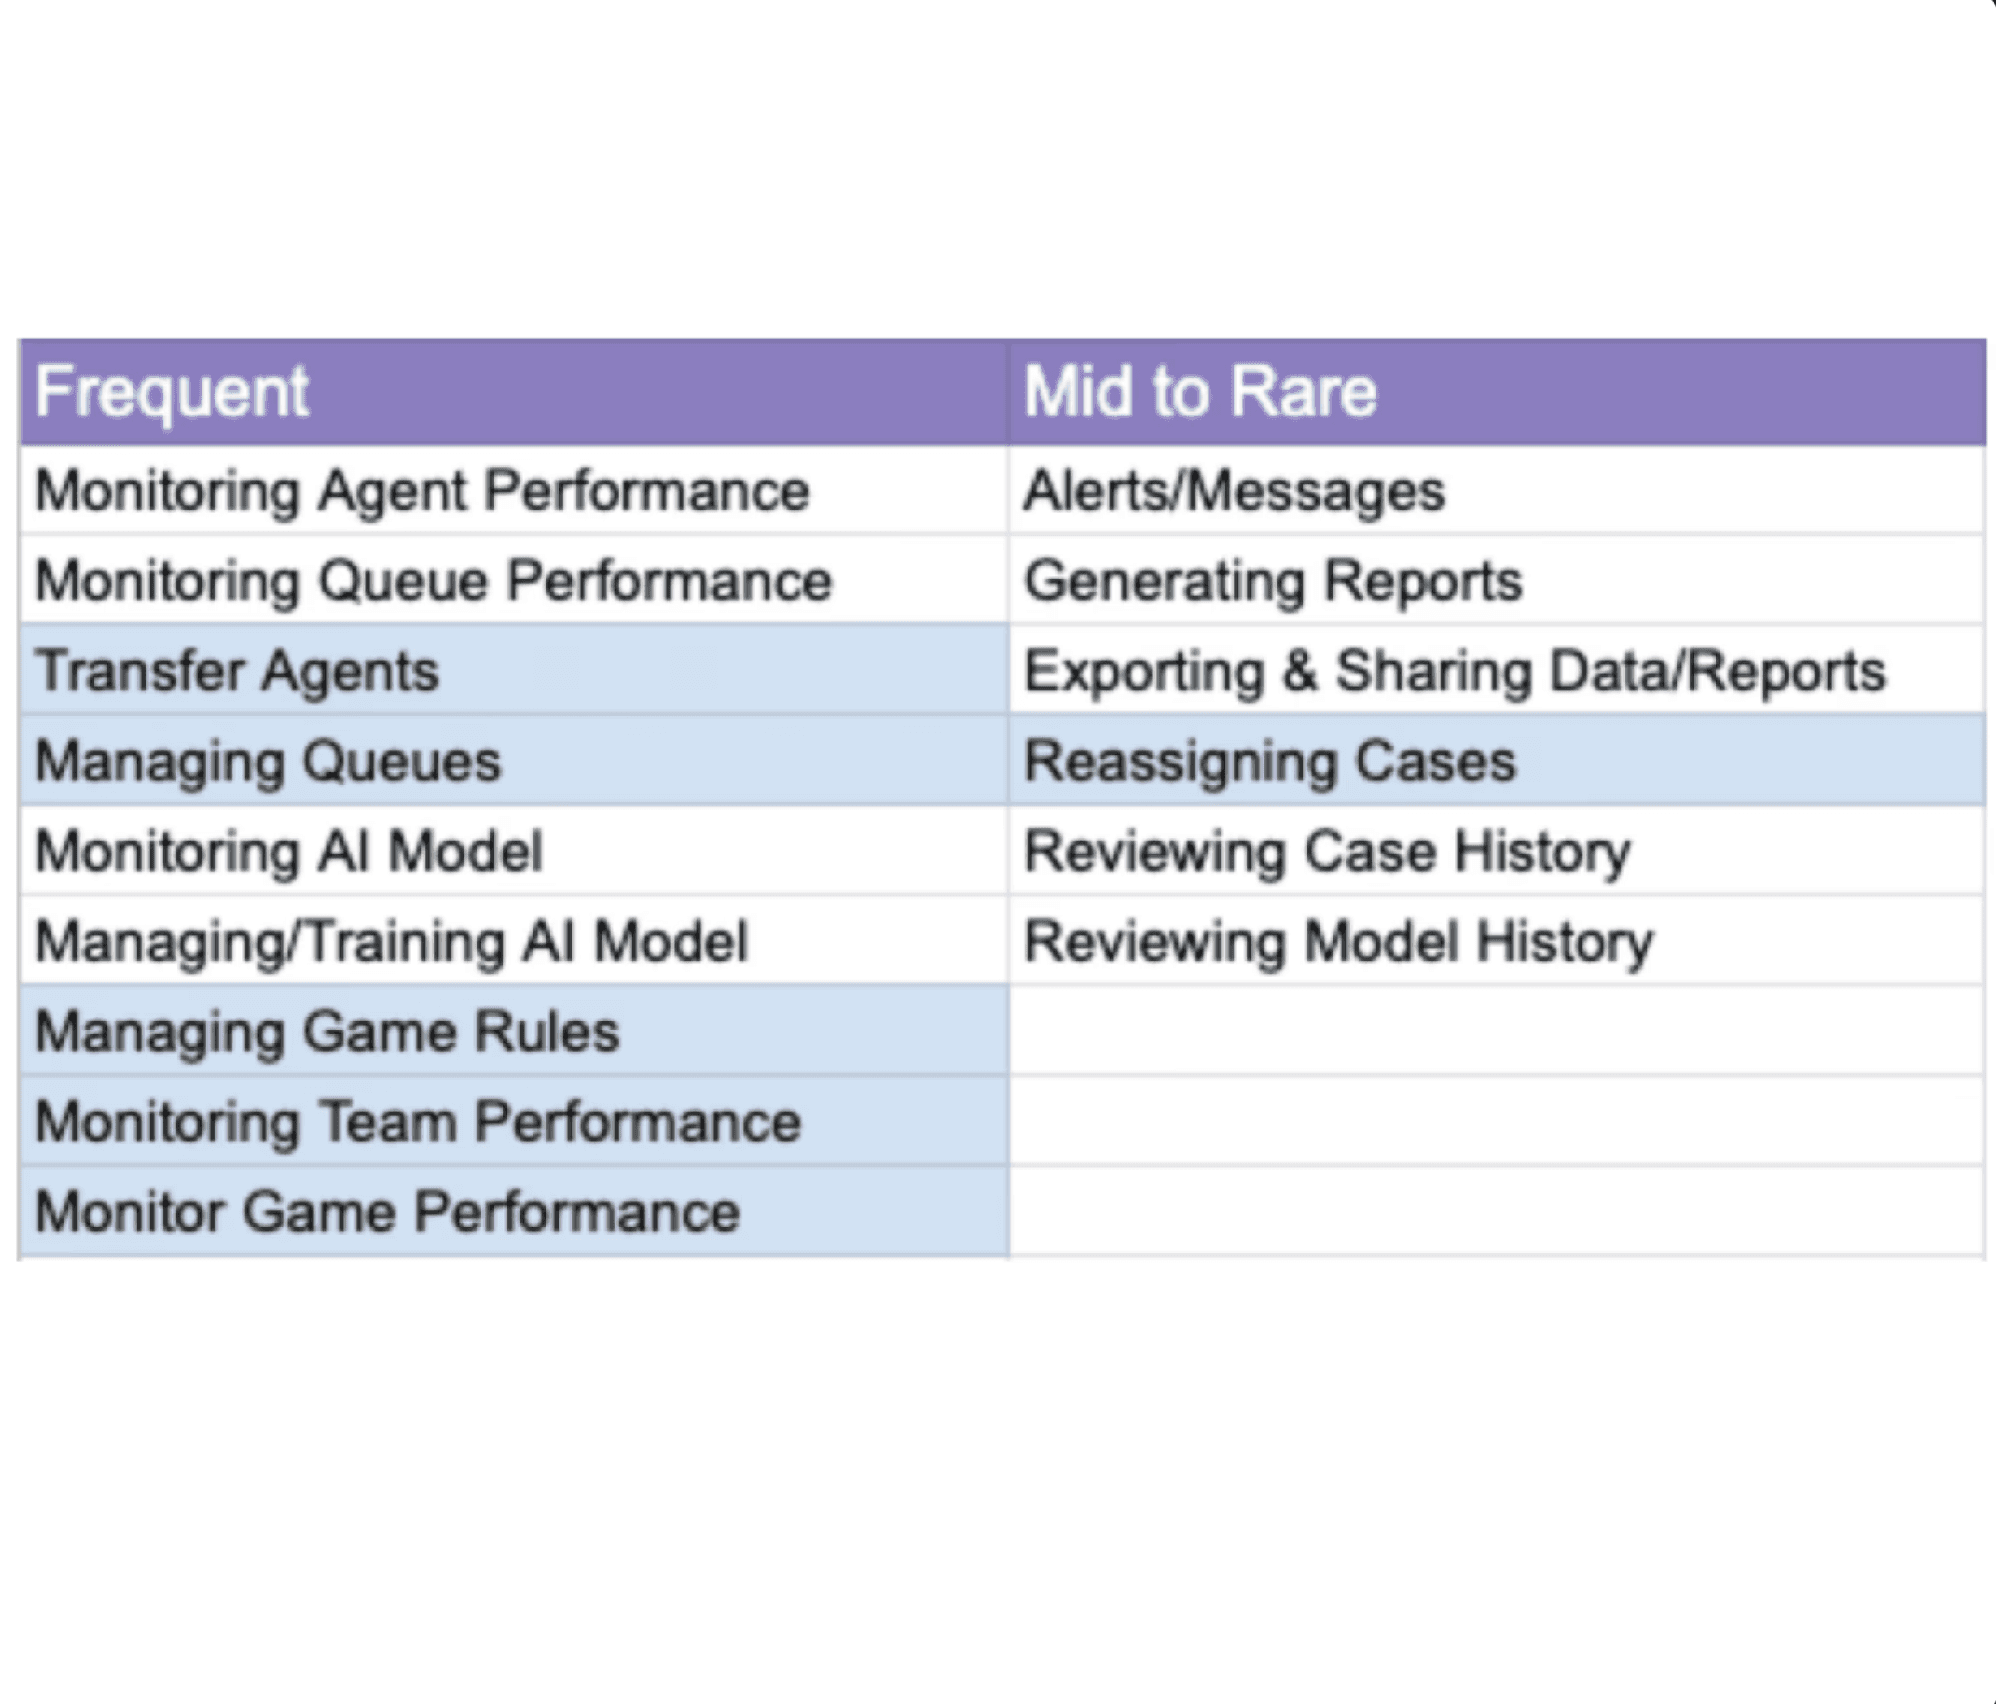
PRIORITY MATRIX
1. Developed a priority matrix to categorize actions into frequent and mid-
to-rare, ensuring focus on tasks like queue performance monitoring and game management
2. Prioritized actions based on criticality to team success, such as reducing queue backlogs or reassigning cases to balance workloads, ensuring seamless daily operations.
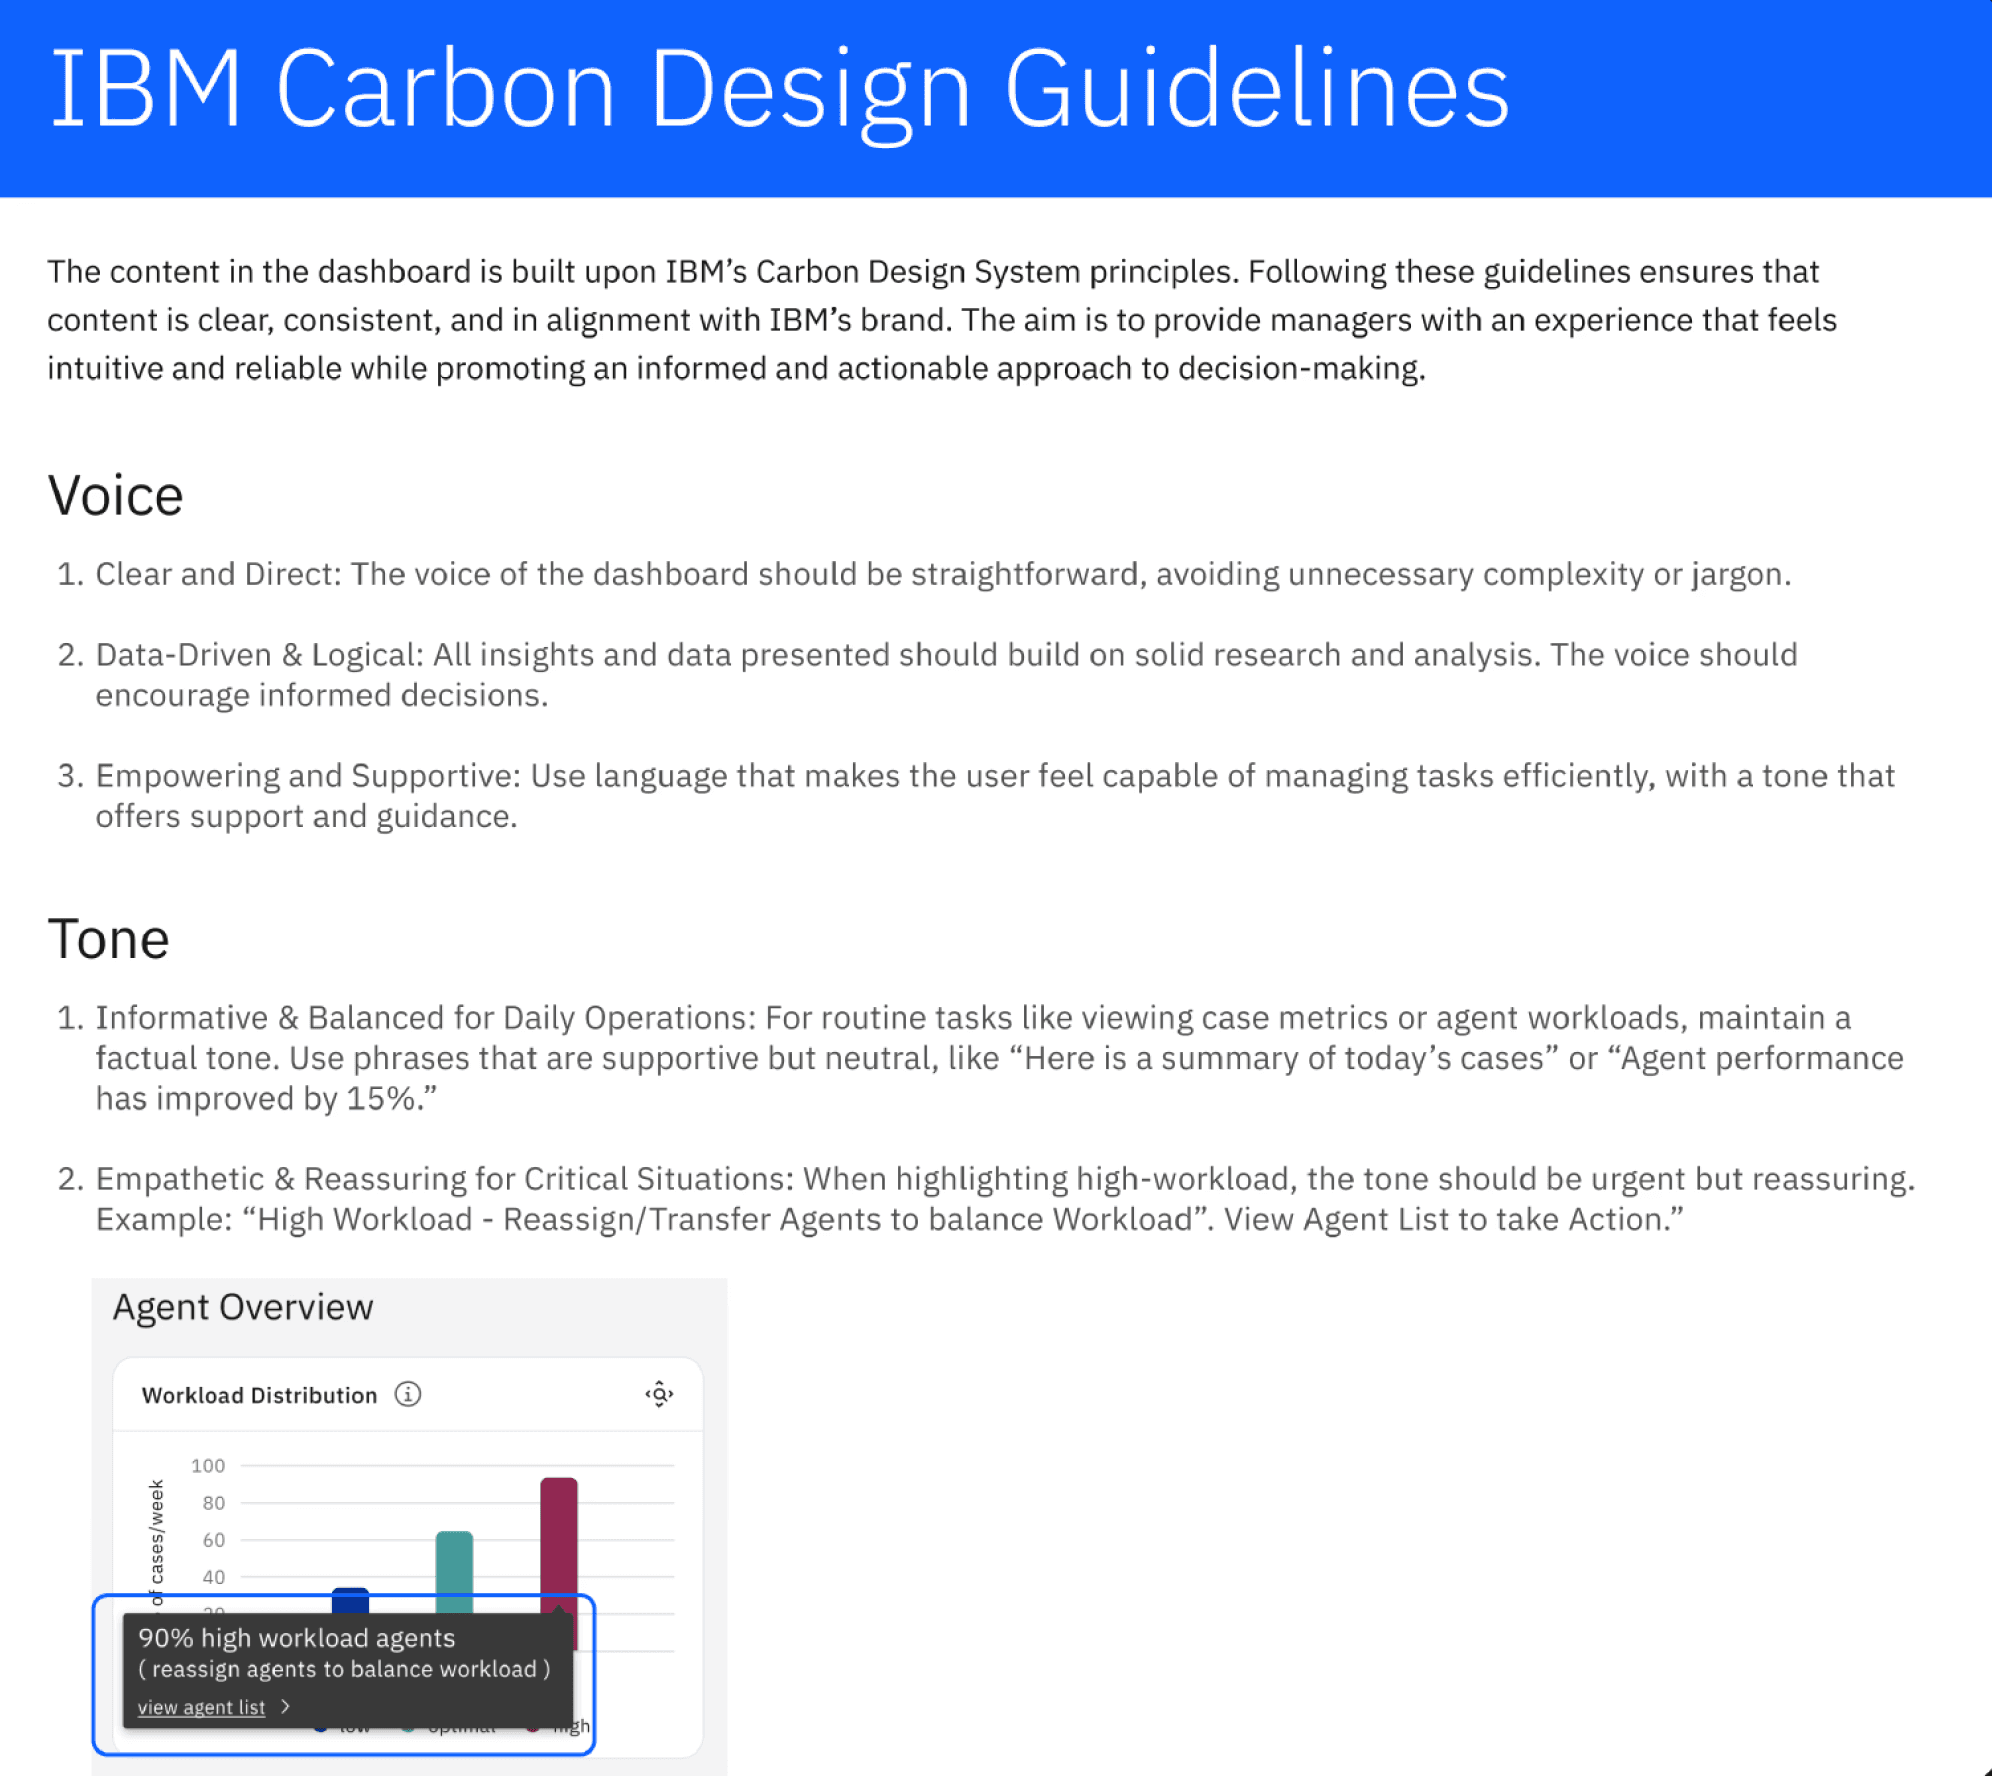
VOICE, TONE, AND WRITING STYLE
1. Defined a voice that was clear, data-driven, and empowering, and a tone that balanced routine operations with critical situations.
2. Writing style emphasized concise, universally understandable content with actionable guidance.
3. Designed messaging to align with user intent, such as proactive prompts during critical situations (e.g., "Consider reassigning cases to balance workload") to enable managers to act decisively.
SEARCH & BROWSE DESIGN
Designed navigation systems prioritizing efficiency and ease of access:
1. Search Design: Included predictive search, saved filters, and
breadcrumbs for efficient data retrieval.
2. Browse Design: Focused on top-priority navigation tabs, drill-down options, and widgets for workload and performance metrics.

GAMIFICATION ECONOMY AND MECHANICS
1. Point Systems: Rewarded agents for cases resolved, accuracy, and collaboration, linking them to tangible rewards like PTO, gift cards, and charity donations.
2. Badges and Leaderboards: Created recognition mechanisms to boost motivation.
3. Challenges and Feedback: Enabled managers to set periodic goals
with real-time progress updates.

DASHBOARD VISUALIZATION SPECIFICATIONS
Followed IBM Carbon Design Guidelines to ensure consistency and clarity:
1. Developed comparison charts, micro-interactions, and normalization visuals to represent productivity and queue health effectively
2. Incorporated dynamic filtering and sorting to allow managers to customize data views.

INFORMATION ARCHITECTURE AND GRIDS
Structured the dashboard using IA grids to ensure intuitive layouts:
1. Global and Local Actions: Differentiated key navigation and task- specific interactions.
2. Agent and Queue Overview Sections: Presented data in modular components to aid quick decision-making.

UNDERSTANDING THE CONTEXT: JOBS-TO-BE-DONE (JTBD) FRAMEWORK
1. Initiated the process with a JTBD framework to understand the
managers' goals, aspirations, and challenges.
2. Mapped out their critical workflows, such as monitoring agent performance, managing queues, and tracking ROI.
OBJECT-ACTION-ATTRIBUTE (OAA) MATRIX
1. Expanded on JTBD insights by creating an OAA matrix to outline the essential objects (agents, cases, queues), their actions, and associated attributes.
2. Enhanced the matrix with Dimensions and Measures, such as velocity, volume, and accuracy, for effective tracking and analysis.
PRIORITY MATRIX
1. Developed a priority matrix to categorize actions into frequent and mid-
to-rare, ensuring focus on tasks like queue performance monitoring and game management
2. Prioritized actions based on criticality to team success, such as reducing queue backlogs or reassigning cases to balance workloads, ensuring seamless daily operations.
VOICE, TONE, AND WRITING STYLE
1. Defined a voice that was clear, data-driven, and empowering, and a tone that balanced routine operations with critical situations.
2. Writing style emphasized concise, universally understandable content with actionable guidance.
3. Designed messaging to align with user intent, such as proactive prompts during critical situations (e.g., "Consider reassigning cases to balance workload") to enable managers to act decisively.
SEARCH & BROWSE DESIGN
Designed navigation systems prioritizing efficiency and ease of access:
1. Search Design: Included predictive search, saved filters, and
breadcrumbs for efficient data retrieval.
2. Browse Design: Focused on top-priority navigation tabs, drill-down options, and widgets for workload and performance metrics.
GAMIFICATION ECONOMY AND MECHANICS
1. Point Systems: Rewarded agents for cases resolved, accuracy, and collaboration, linking them to tangible rewards like PTO, gift cards, and charity donations.
2. Badges and Leaderboards: Created recognition mechanisms to boost motivation.
3. Challenges and Feedback: Enabled managers to set periodic goals
with real-time progress updates.
DASHBOARD VISUALIZATION SPECIFICATIONS
Followed IBM Carbon Design Guidelines to ensure consistency and clarity:
1. Developed comparison charts, micro-interactions, and normalization visuals to represent productivity and queue health effectively
2. Incorporated dynamic filtering and sorting to allow managers to customize data views.
INFORMATION ARCHITECTURE AND GRIDS
Structured the dashboard using IA grids to ensure intuitive layouts:
1. Global and Local Actions: Differentiated key navigation and task- specific interactions.
2. Agent and Queue Overview Sections: Presented data in modular components to aid quick decision-making.
Key features
Discovery and Collection of Bets
Key features
Discovery and Collection of Bets
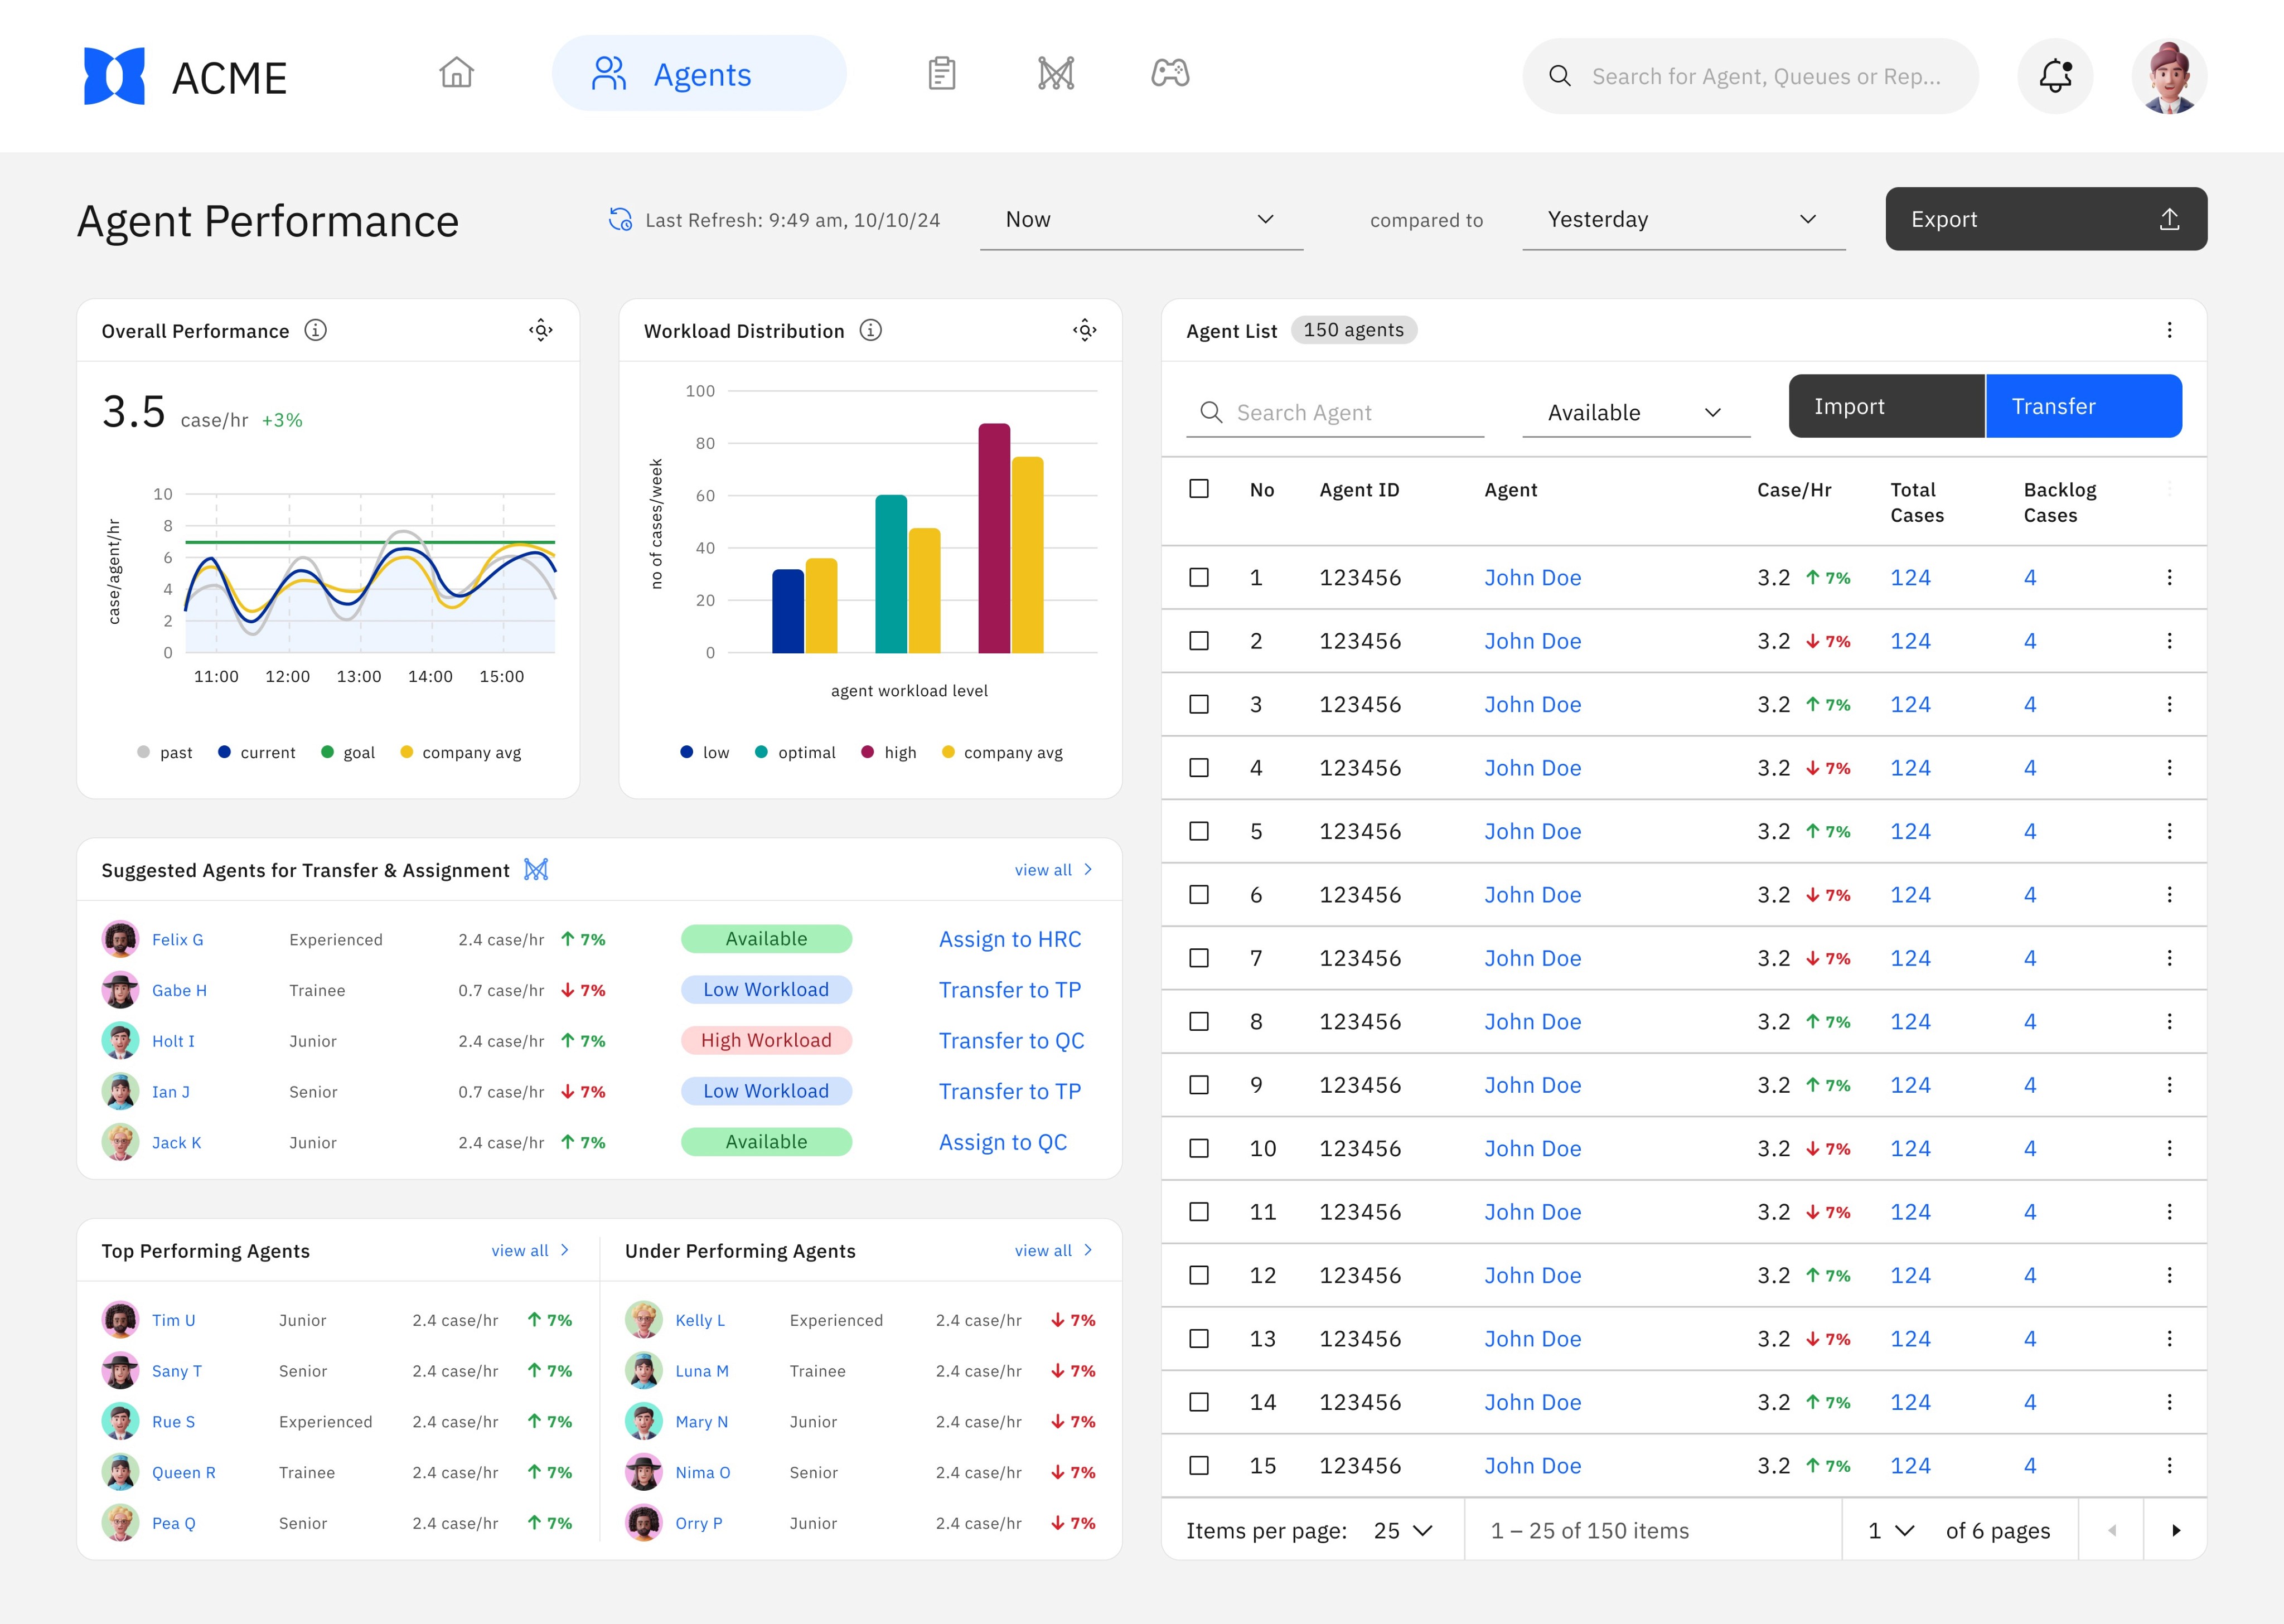
Performance Dashboard
A comprehensive view of agent performance, case queues, and team productivity.
Real-time metrics with trend indicators
Quick insights into workloads, resolution rates, and queue health
Strategic prioritization of key metrics at the top

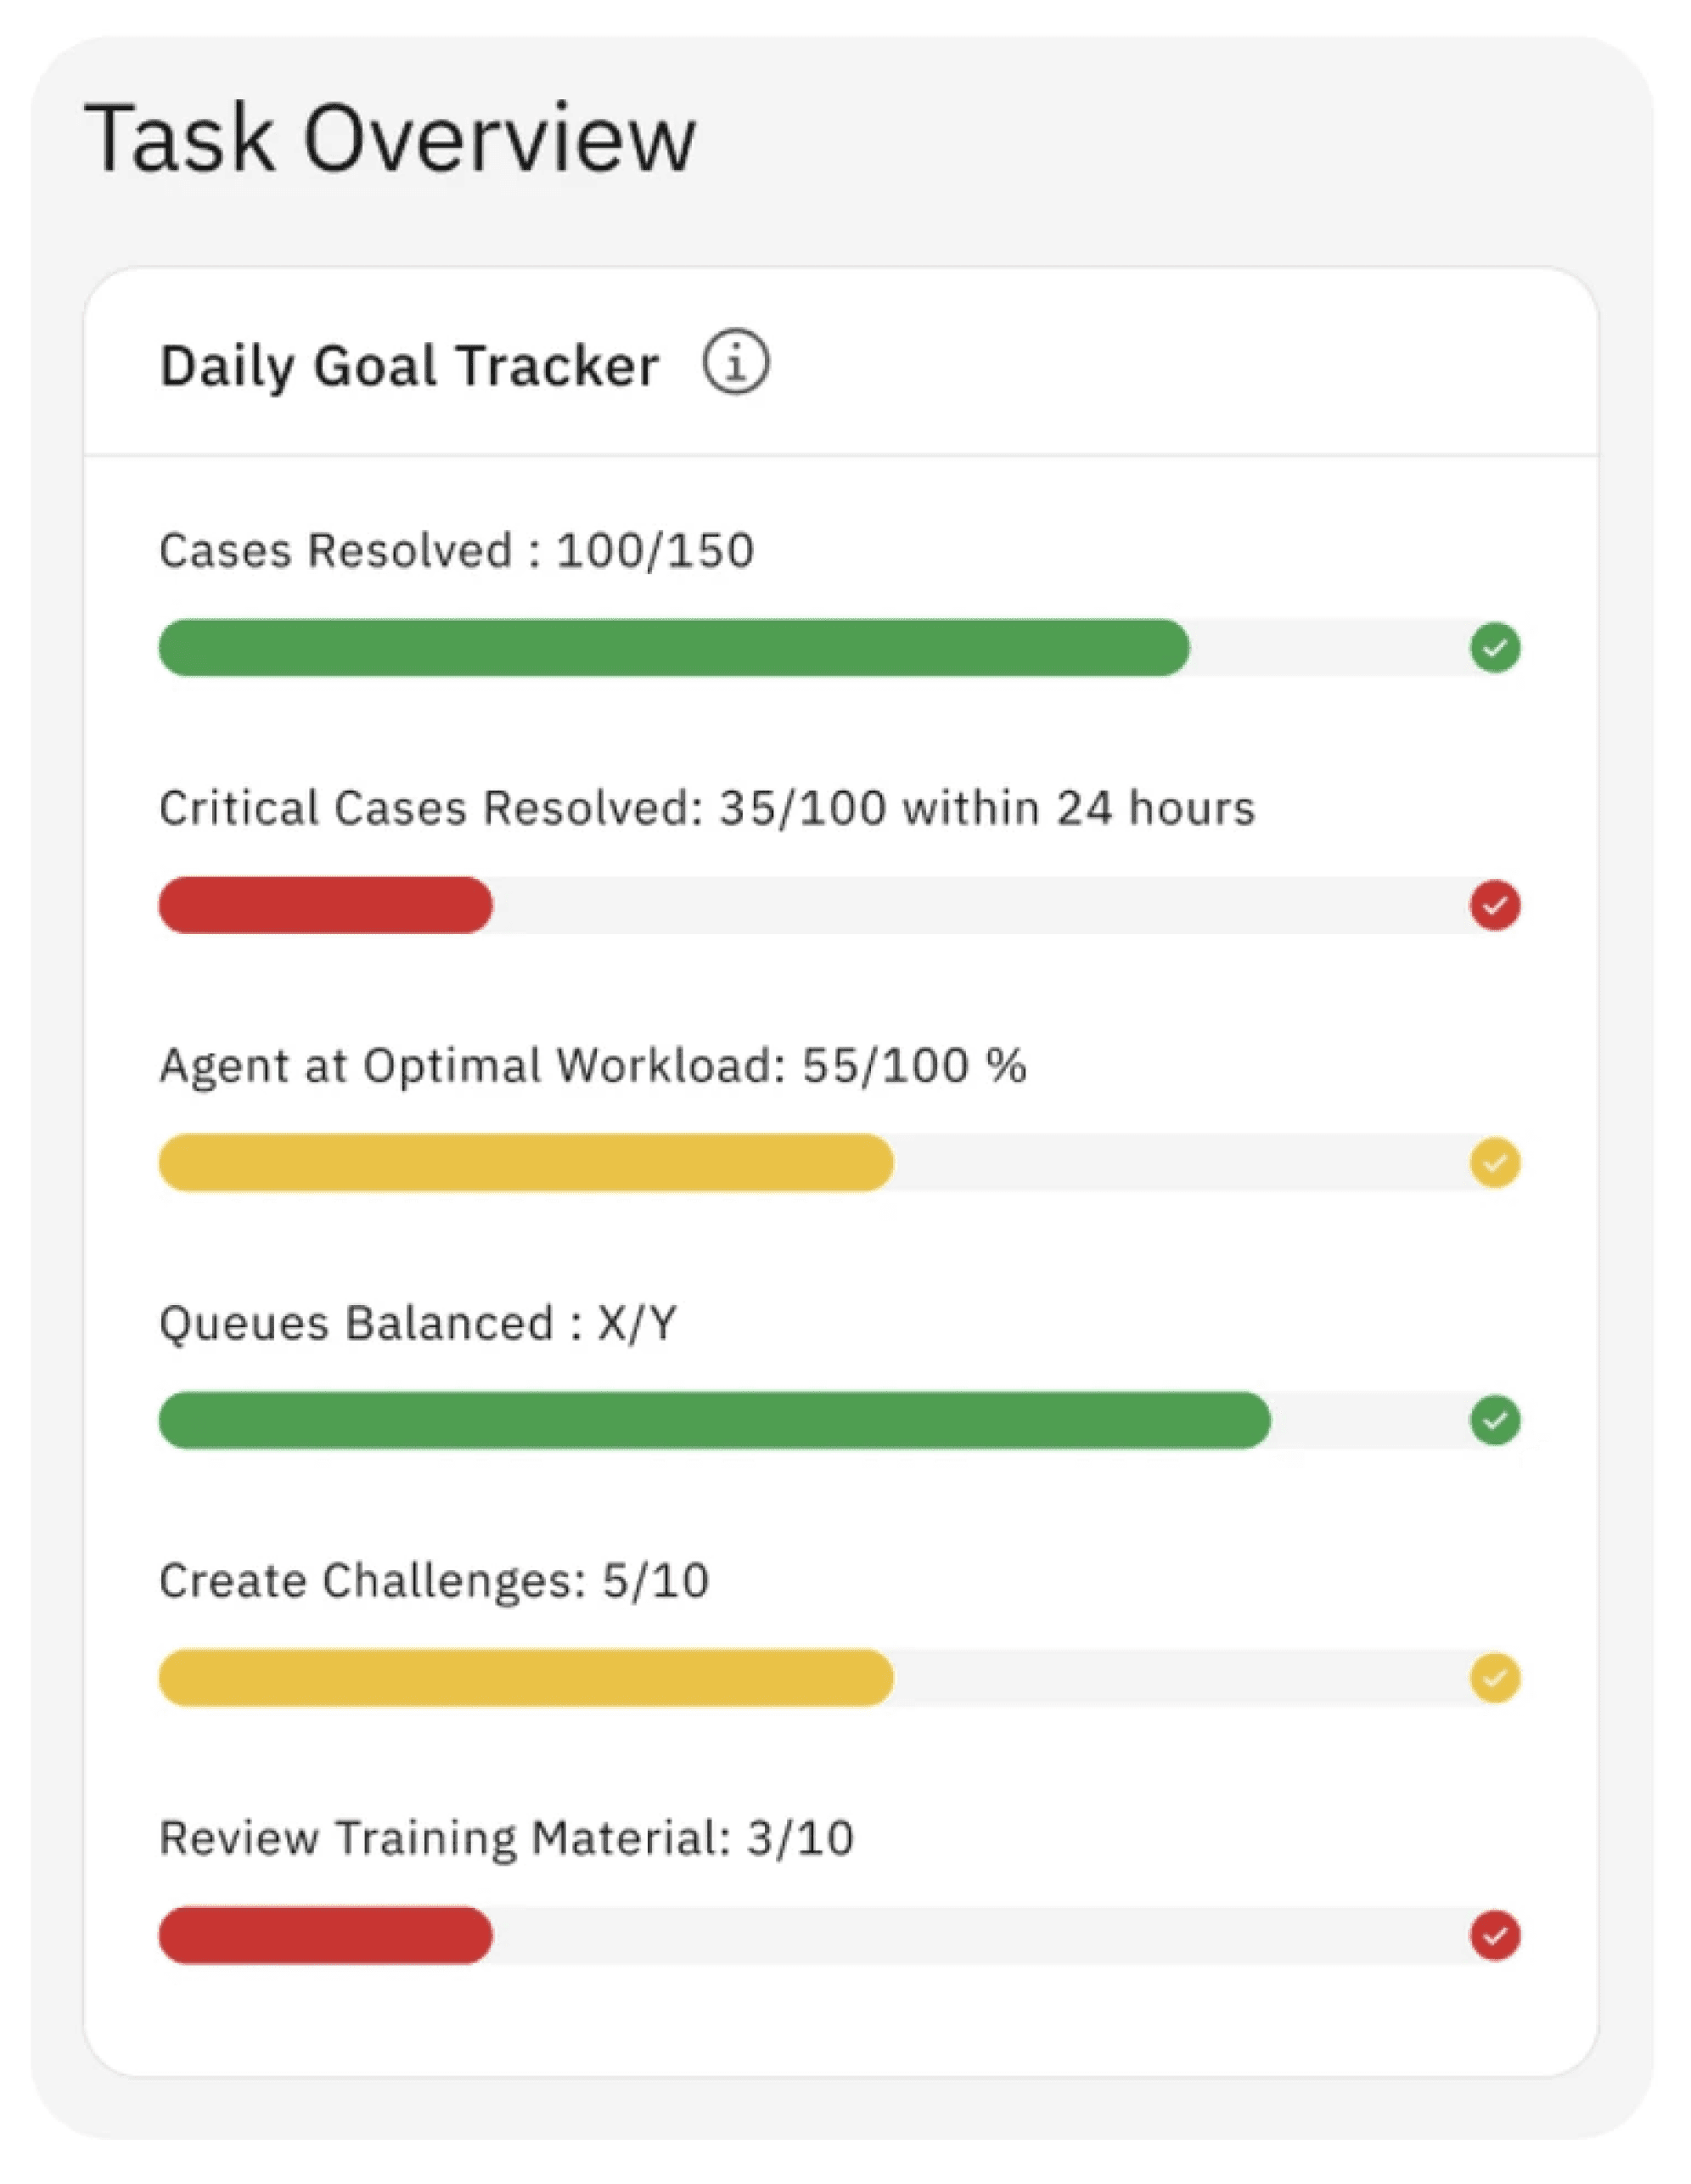
DAILY GOAL TRACKER
Color-coded visual bars (green, yellow, red) to track task completion.
Helps managers stay aligned with daily goals
Reinforces accountability and promotes timely interventions
AGENT PERFORMANCE & ASSIGNMENT INSIGHTS
Compare top and underperformers with actionable insights.
Smart suggestions for case redistribution
Dynamic status indicators and quick action buttons

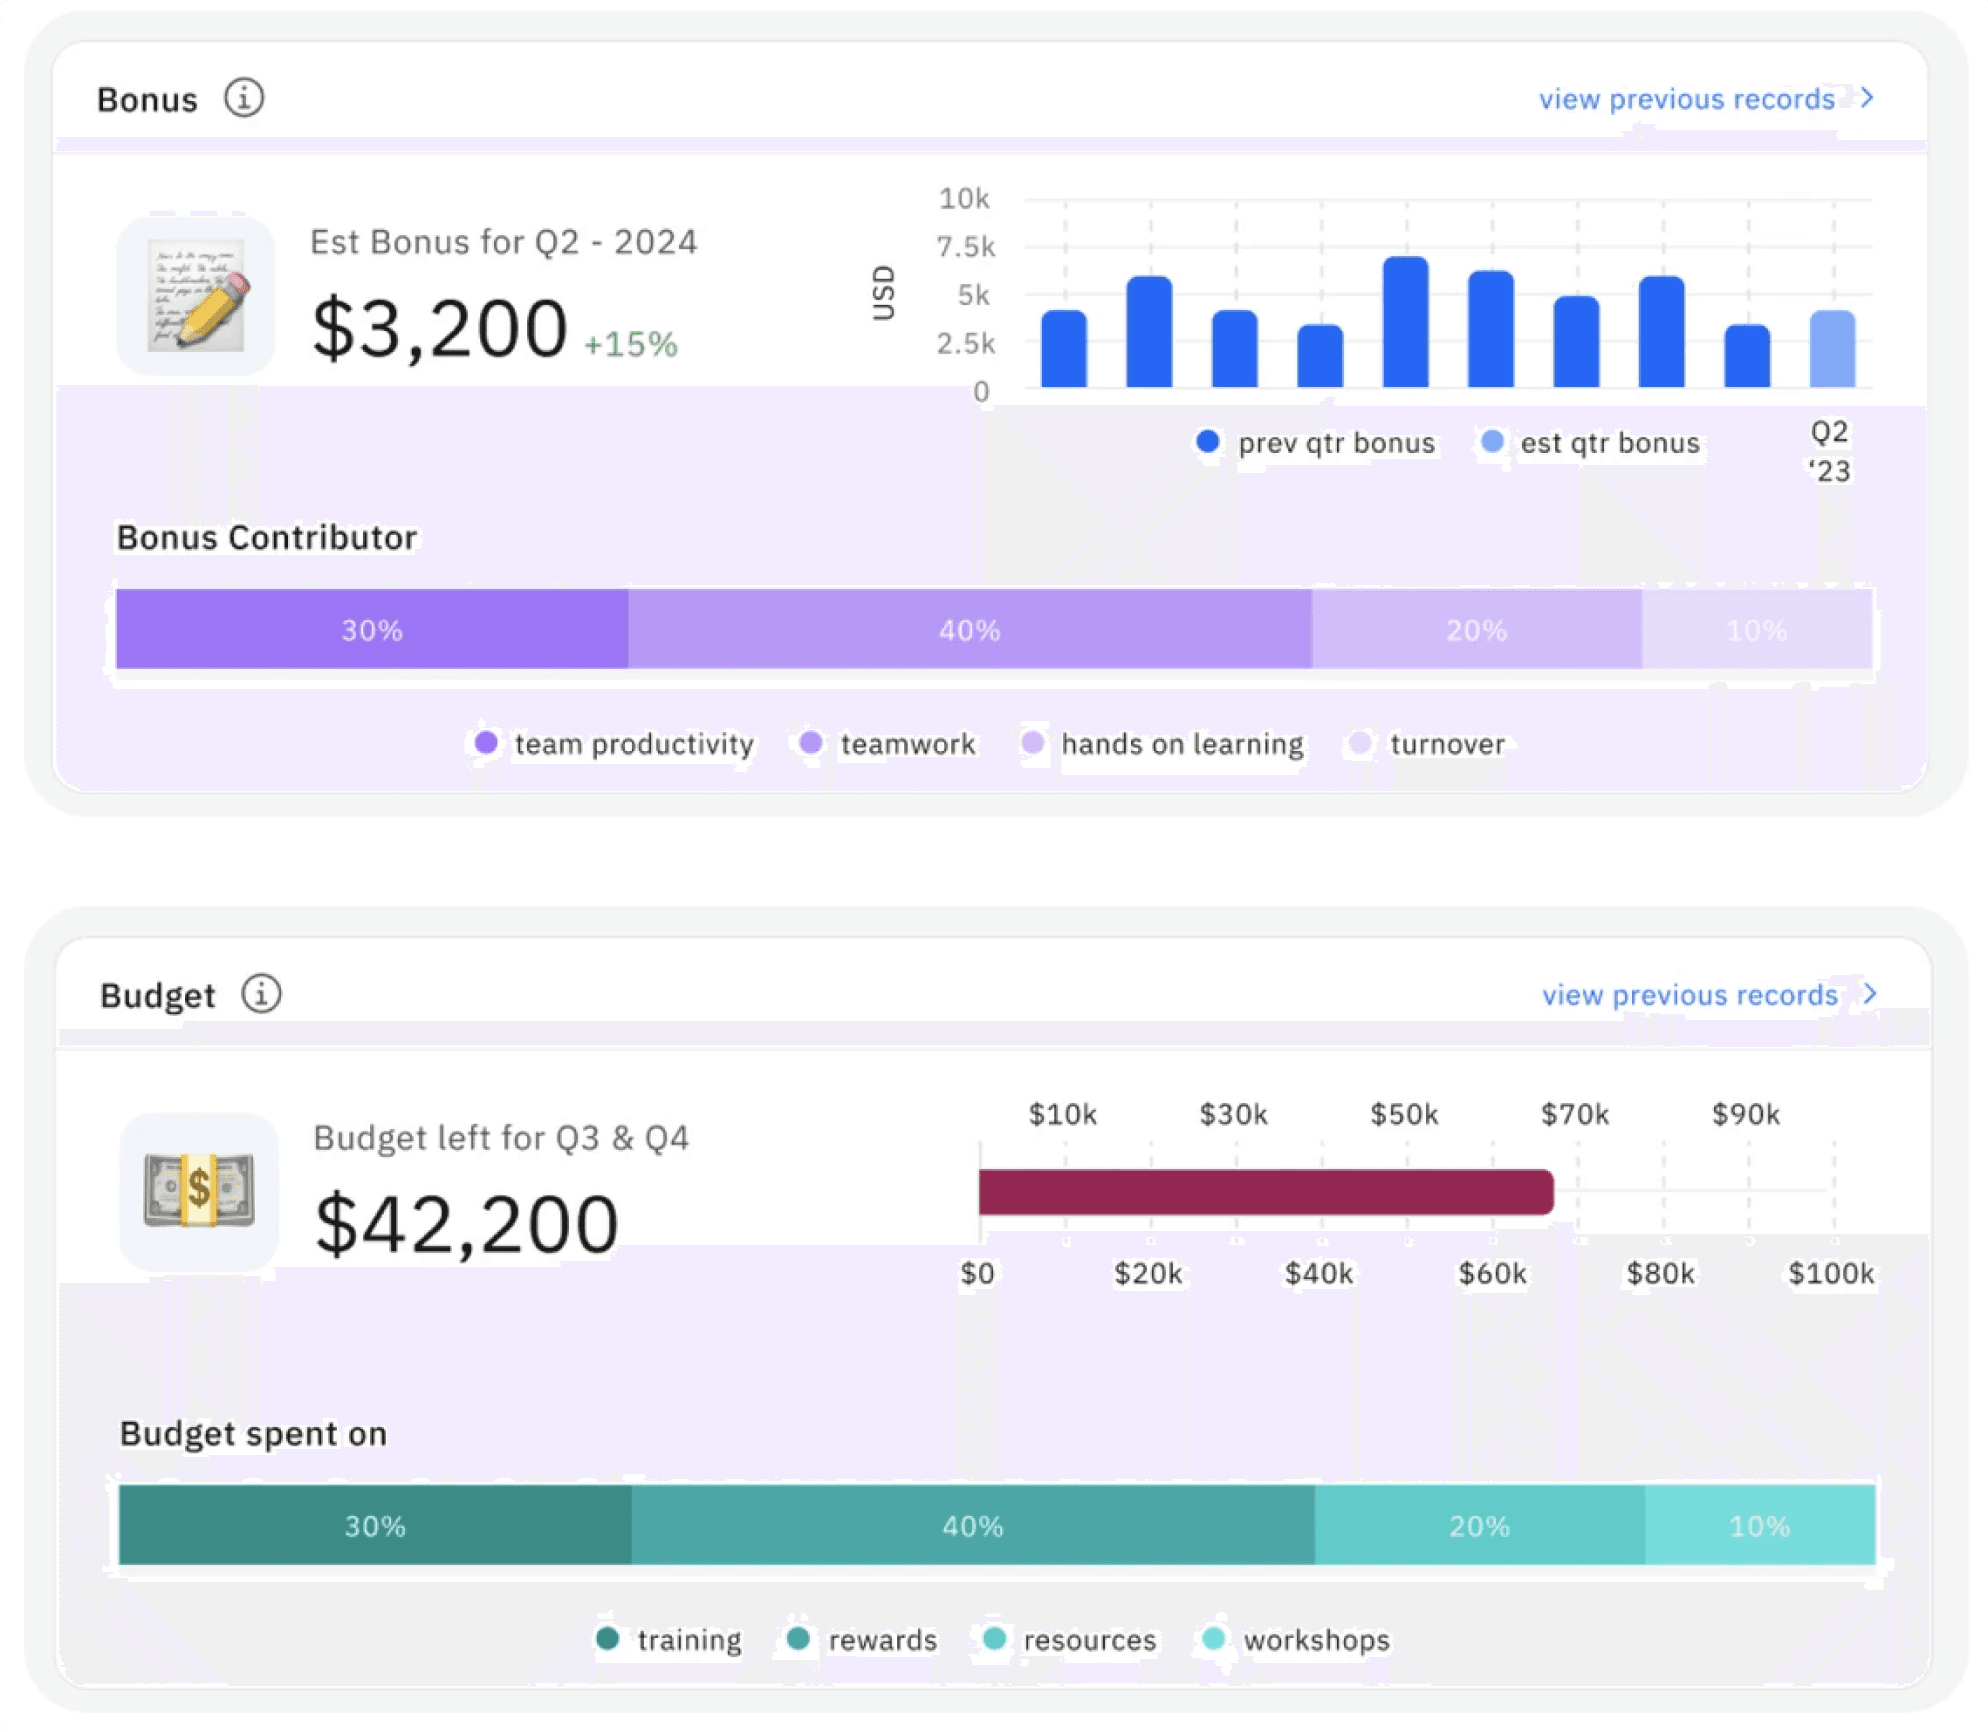
MANAGER BONUS AND BUDGET OVERVIEW
Visual breakdowns of budget allocation and bonus progress.
Aligns manager incentives with team performance
Enables smarter planning for training, rewards, and resources
MANAGER BONUS AND BUDGET OVERVIEW
Visual breakdowns of budget allocation and bonus progress.
Aligns manager incentives with team performance
Enables smarter planning for training, rewards, and resources
ROI & MULTI-METRIC CHARTS
Data visualizations showcasing the impact of gamification.
Track metrics like productivity, accuracy, and teamwork over time
Compare pre- and post-gamification outcomes

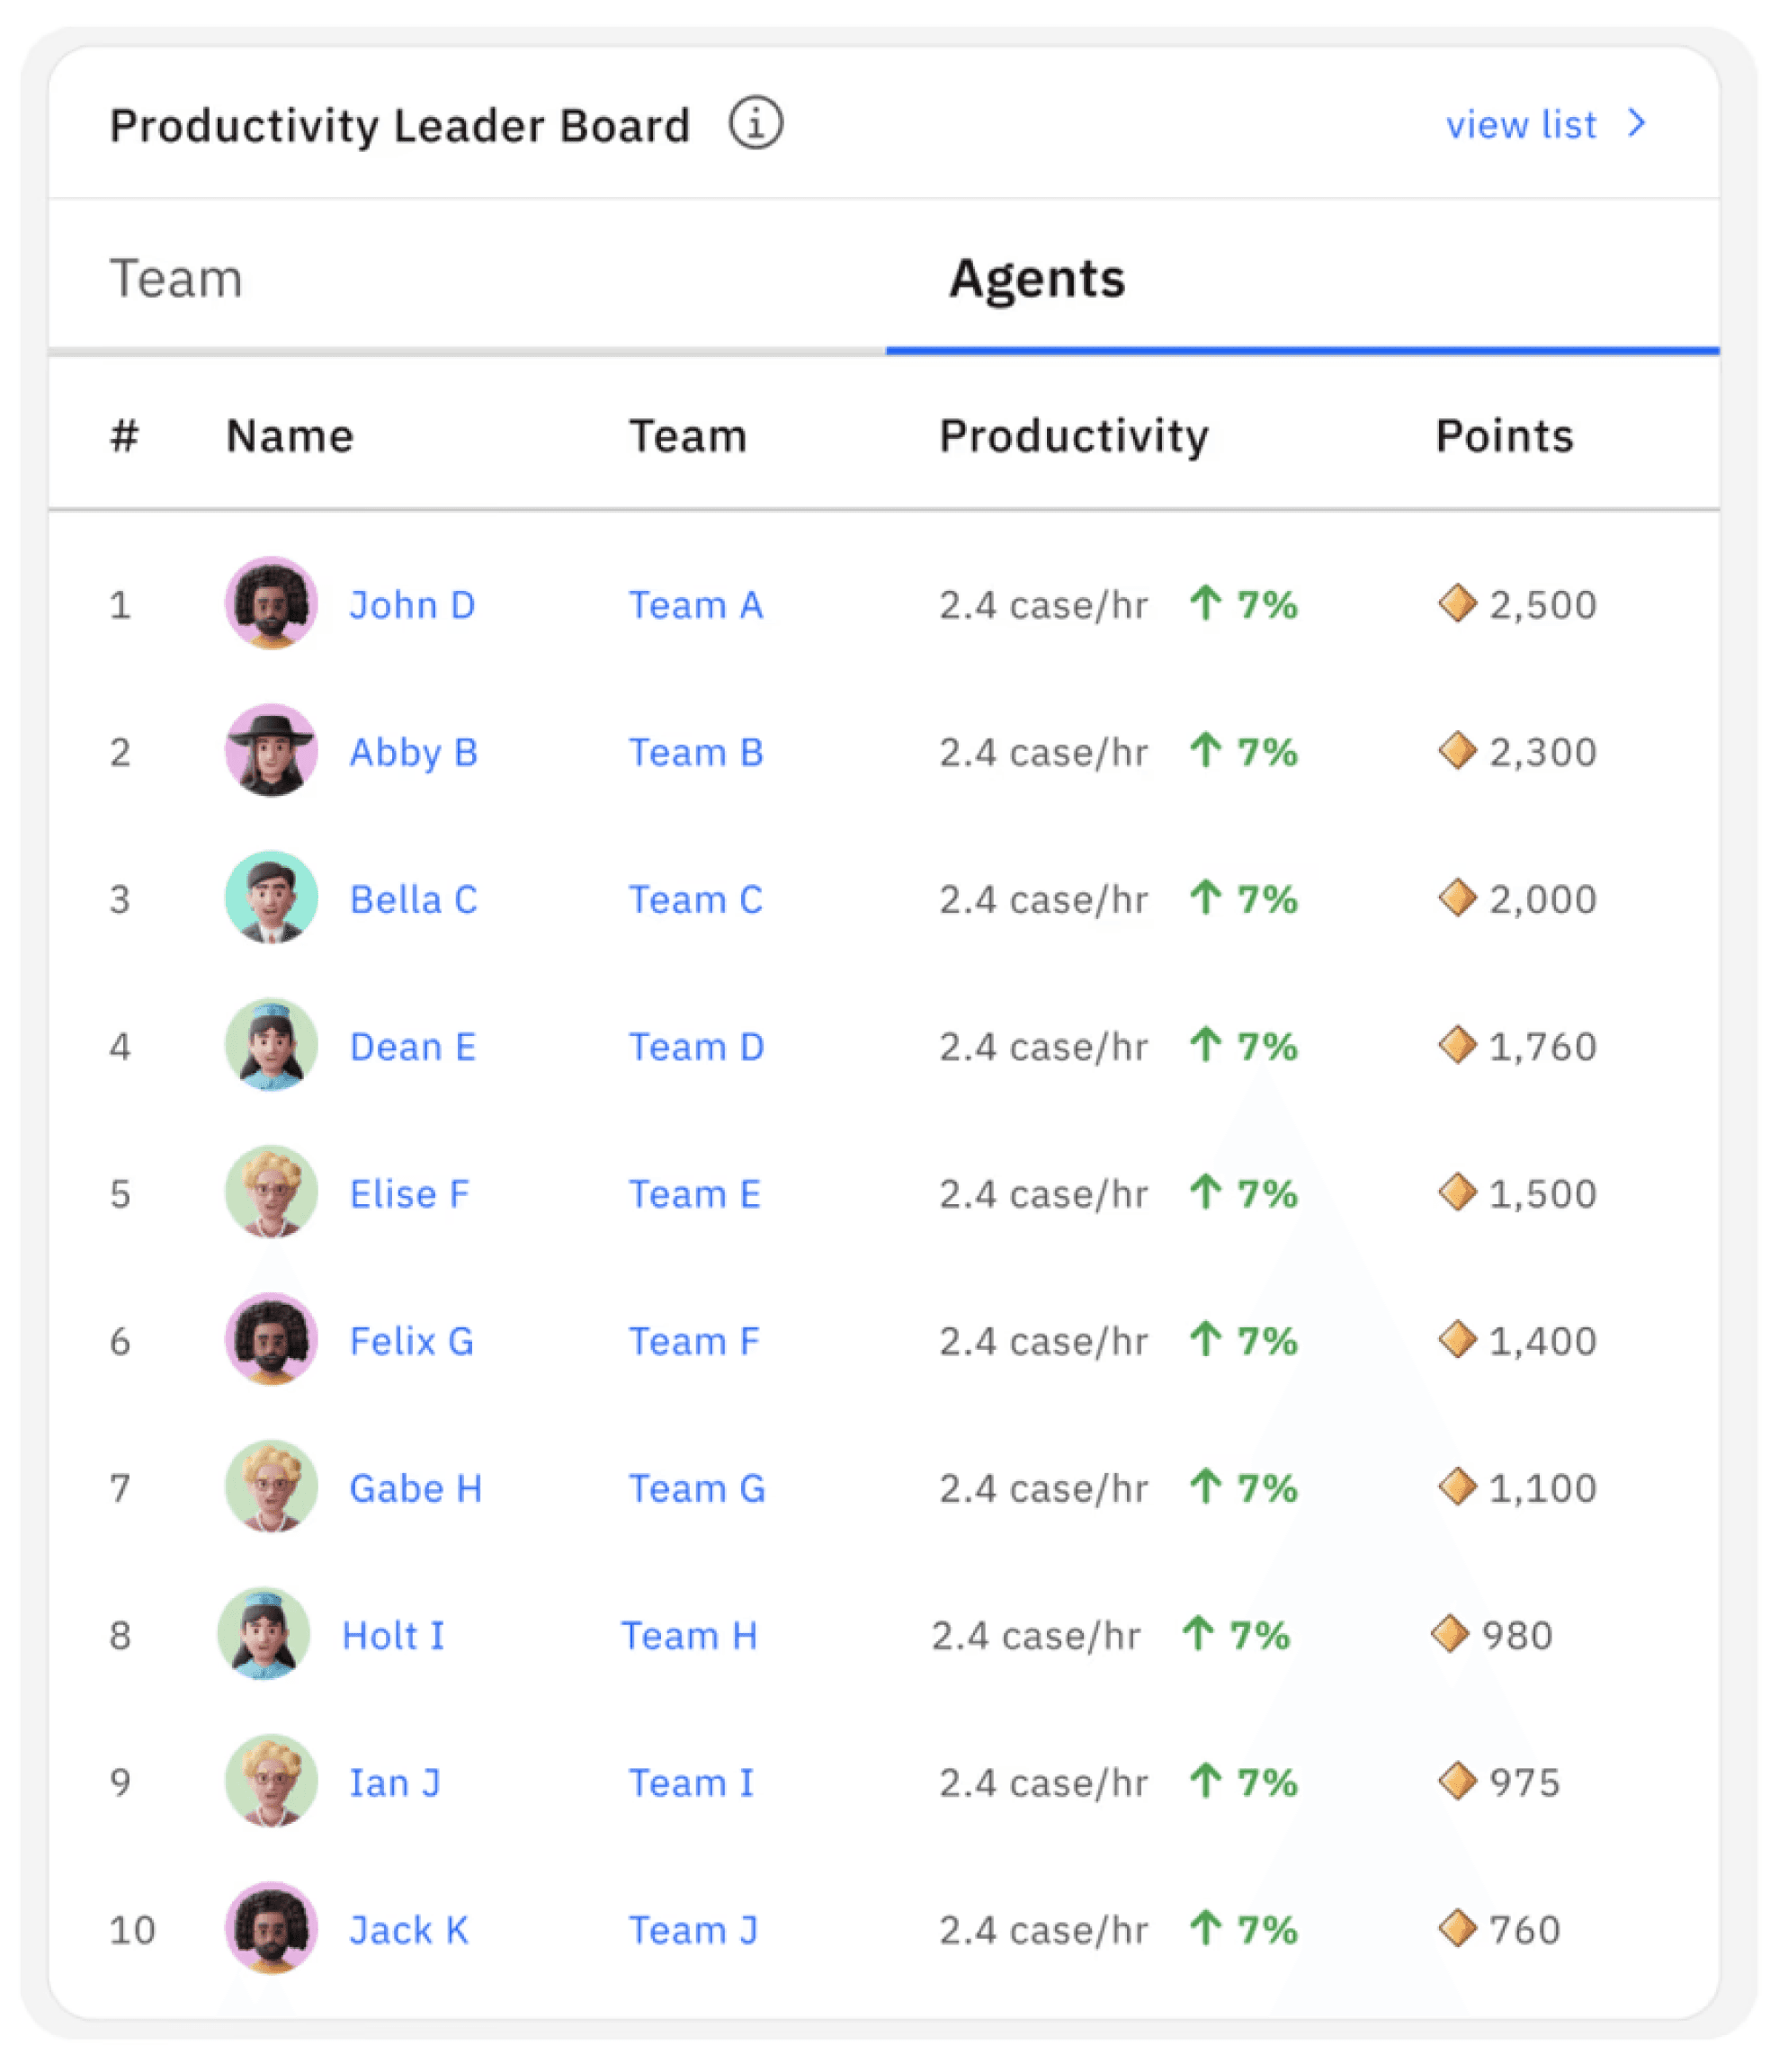
LEADERBOARDS
Foster a competitive yet collaborative culture.
Recognize top performers
Reinforce reward systems tied to real impact
CHALLENGE CREATION INTERFACE
A streamlined builder for gamified challenges.
Custom goals (completion-based, accuracy-based, etc.)
Built-in budget tracking and transparency
Options for both positive and negative reinforcements

High Fidelity Design
High Fidelity Design


Key Takeaways
Key Takeaways
Iterative Design Process: Balancing user needs and organizational goals requires continuous iteration, from JTBD frameworks to high-fidelity prototypes.
Iterative Design Process: Balancing user needs and organizational goals requires continuous iteration, from JTBD frameworks to high-fidelity prototypes.
Data-Driven Design Decisions: Metrics like ROI, productivity, and team collaboration proved pivotal in shaping an outcome that delivers real value to managers and their teams.
Data-Driven Design Decisions: Metrics like ROI, productivity, and team collaboration proved pivotal in shaping an outcome that delivers real value to managers and their teams.
User-Centered Focus: Understanding the manager's role through research was crucial to creating an experience that is practical and effective for day-to-day operations.
User-Centered Focus: Understanding the manager's role through research was crucial to creating an experience that is practical and effective for day-to-day operations.
Gamification's Impact: Thoughtfully designed challenges, leaderboards, and rewards motivate performance and instill accountability across all levels.
Gamification's Impact: Thoughtfully designed challenges, leaderboards, and rewards motivate performance and instill accountability across all levels.
Future Opportunities: This project demonstrated the scope for expanding gamification to new organizational contexts, fostering engagement and performance across diverse scenarios.
Future Opportunities: This project demonstrated the scope for expanding gamification to new organizational contexts, fostering engagement and performance across diverse scenarios.
